Monitoring Lake Surface Area Using Satellites
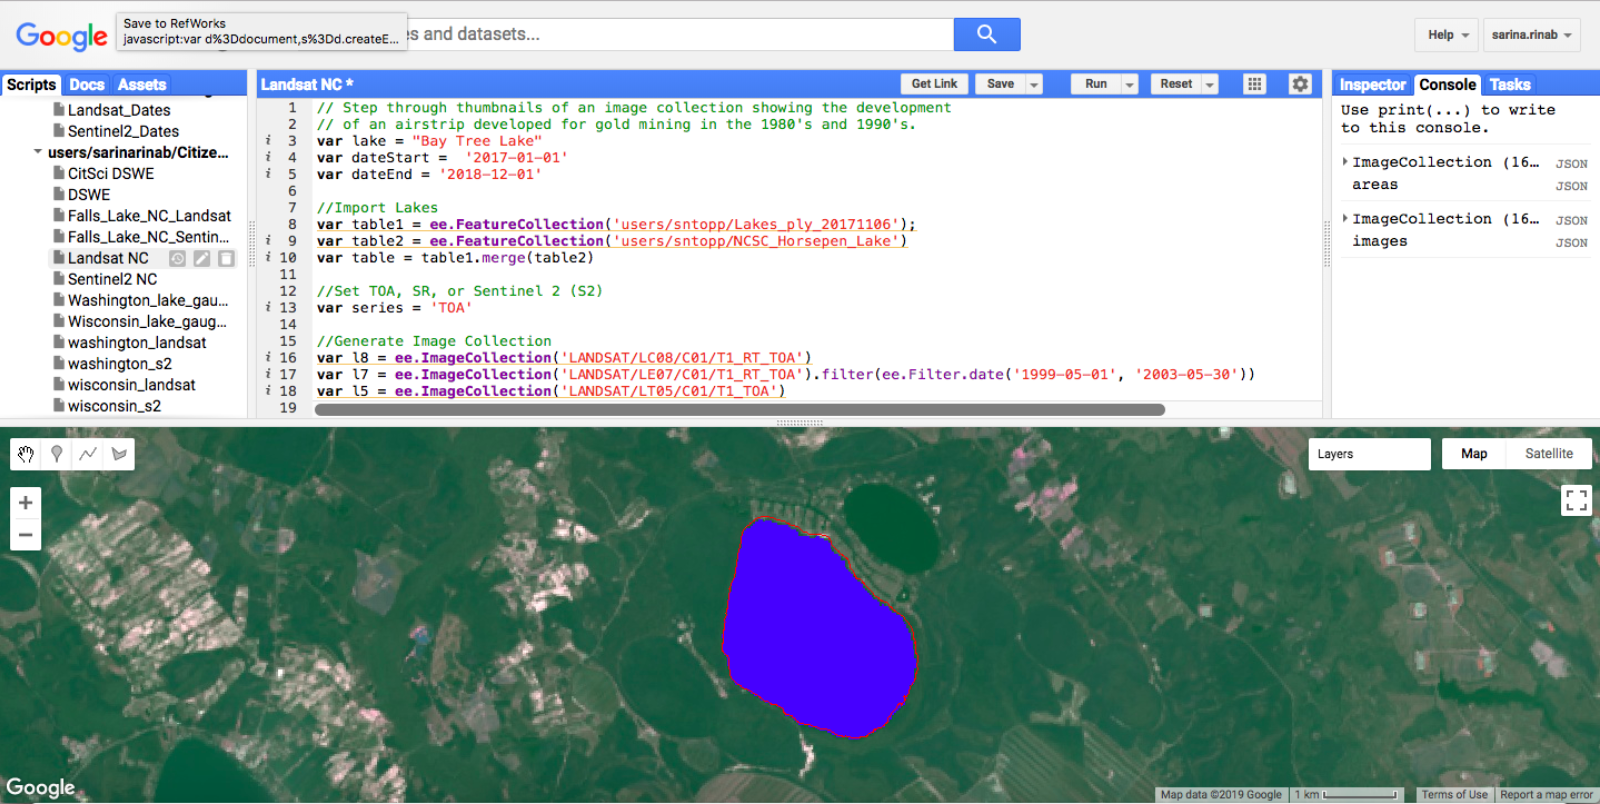 Screenshot of Google Earth Engine, including an image of Bay Tree Lake in North Carolina with a water mask.
The development of remote sensing techniques has vastly expanded our abilities to monitor the earth and its natural resources, including water. As part of the LOCSS Project, we are using satellite imagery to monitor changes in the surface area of our study lakes.
Our work begins with gathering photos of the lakes at different periods of time using images from various satellites. The images we use for this study are collected from several different satellites. They include Landsat 5, 7, and 8, as well as Sentinel 2. Images are taken every 16 days by the Landsat satellites and every 5 days by the Sentinel 2 satellites. We are gathering and storing every image taken of the lakes since the beginning of the LOCSS Project.
To calculate the surface area in our lakes, we use a platform called Google Earth Engine (GEE). GEE is a web tool that provides access to software and other tools that can be used to study satellite images. Though only established towards the end of 2010, many scientists have used Google Earth Engine for a wide range of projects, ranging in topic from land cover change to malaria outbreaks.
Above is an example of what the Google Earth Engine Platform looks like. The center top panel is the control panel where the program is run. The bottom half is where the satellite image is displayed. This particular image was taken by NASA’s Landsat8 satellite and shows Bay Tree Lake in North Carolina. The water in the lake is identified by a blue “water mask” which is created in GEE by a program that can detect the difference between water and land. We then calculate the size of that water mask for of our lake photos to determine the lake surface area.
Not all of the satellite images are useful however, and we need to filter out the bad images. What do we filter for? We work to filter out photos with clouds and their shadows. Clouds and cloud shadows will cause error in the lake surface area calculations if they are above the lake. Clouds block parts of the lake from being seen in the image, so GEE will underestimate lake surface area in those calculations. Cloud shadows, on the other hand, appear similar to water in an image. If this occurs outside of a lake, it may appear as if there is more water in the lake and lake surface area is overestimated. It is important to get rid of these images to avoid lake surface area miscalculations.
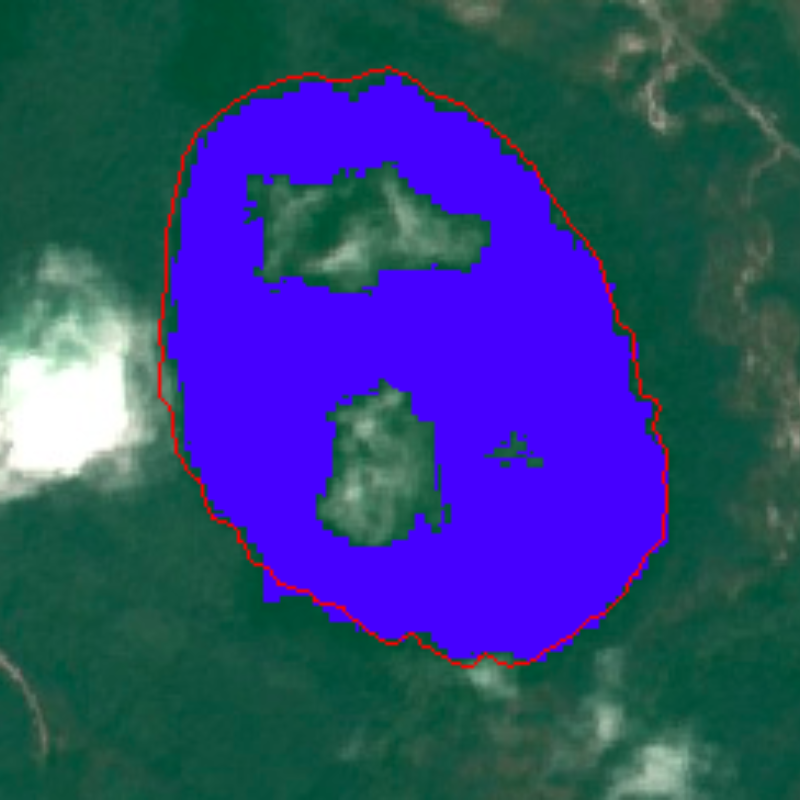 Image 2 Moderate Cloud Cover
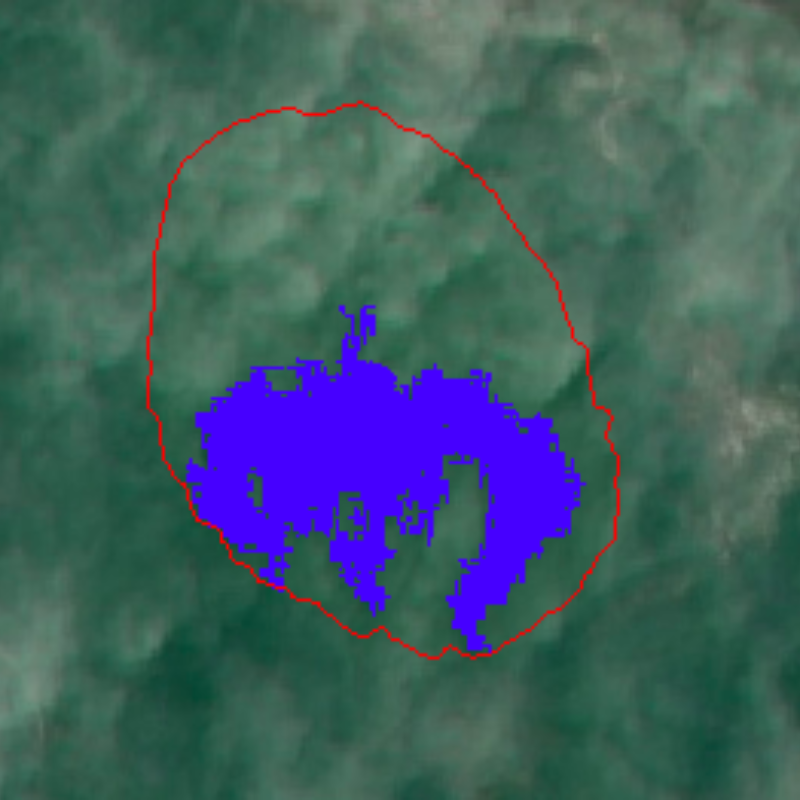 Image 3 Extreme Cloud Cover
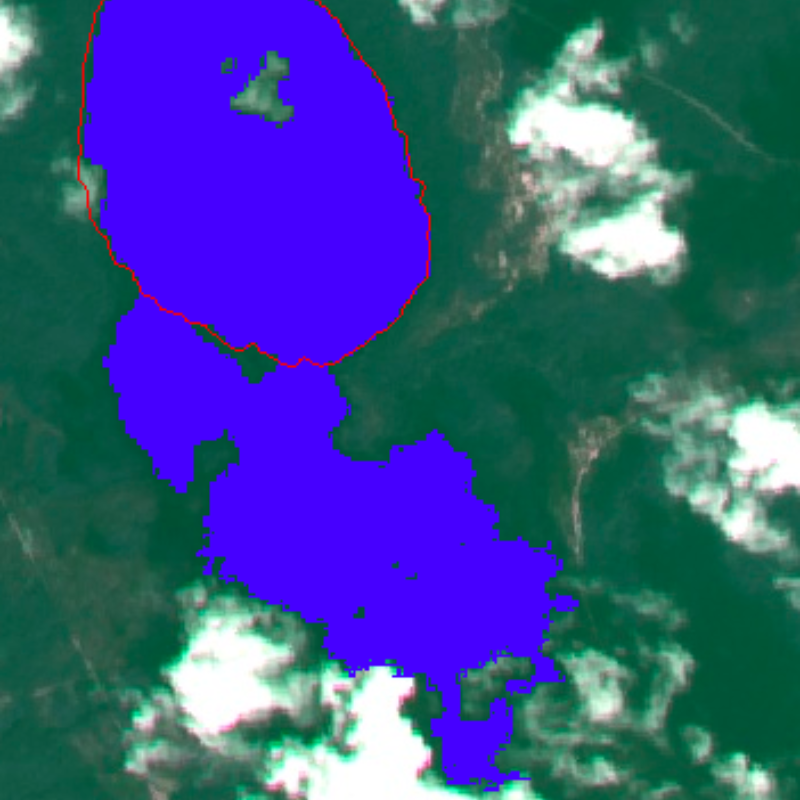 Image 4 Cloud Shadow
Above are four Sentinel 2 images of Salters Lake in North Carolina with water masks. Image 1 shows the lake without cloud cover and an accurate water mask. Image 2 is of the lake with a few clouds in the middle of the lake, resulting in an inaccurate water mask leading to an underestimation of lake surface area. Image 3 shows the lake with extreme cloud cover. Barely any water mask can be calculated leading to a gross underestimation of lake surface area. The fourth image is of the lake with cloud shadow, resulting in an over-sized water mask leading to an overestimation of lake surface area.
We are working to create a function that can solve the problems caused by clouds and cloud shadows by filling in water masks where clouds are present. This will allow us to use more images in the collection, bettering our analysis of lake storage change over time. Until then, however, we will keep filtering out the images.
There are several different methods that can be used to create the water mask for an image. We are using the OTSU Thresholding approach and the Dynamic Surface Water Extent (DSWE) approach. One current drawback about DSWE is that it is only applicable for Landsat images. Future work involves applying the method to Sentinel 2 images.
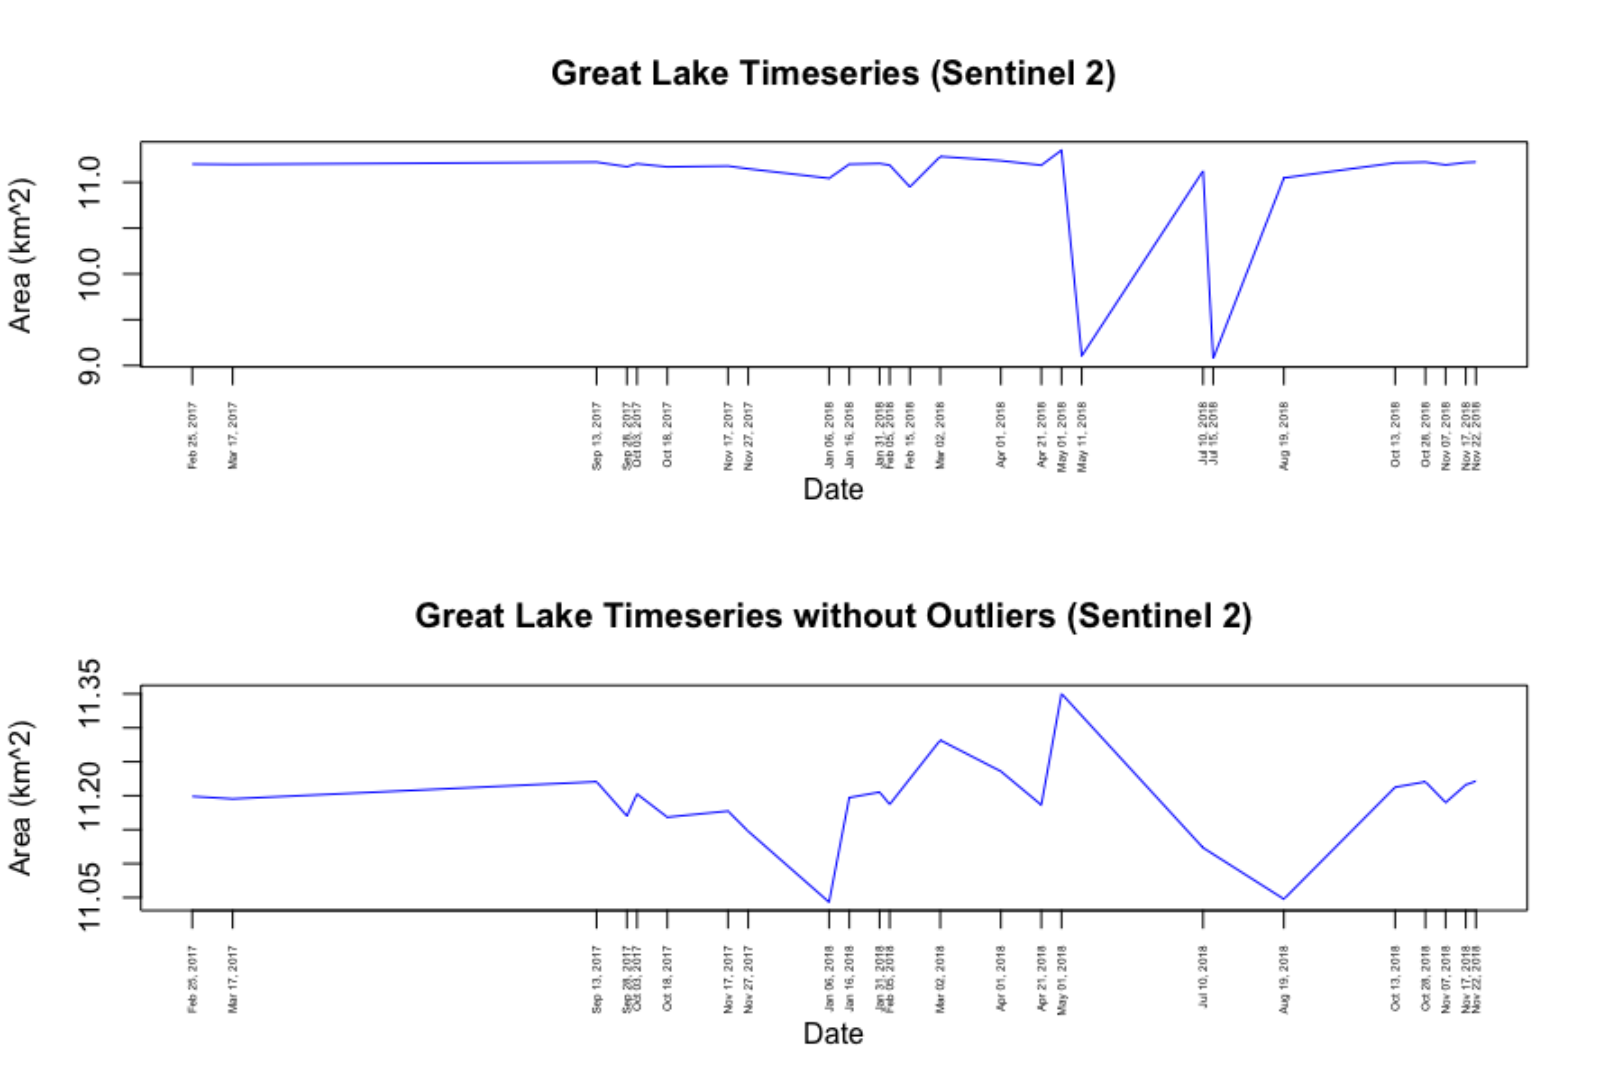
Once we have our water masks determined we can finally calculate lake water surface area. Calculations of lake water surface area are done for each image collected for each lake and put together in chronological order creating a time series. There is a function written to do this calculation in GEE using the determined water masks. Below is are time series graphs showing how the surface area of Great Lake in Eastern North Carolina has fluctuated from the beginning of the LOCSS Project through the end of 2018. The horizontal axis represents time and the vertical axis represents surface area. The top graph shows the lake surface area change which may include cloud errors. The bottom graph shows the lake surface area change after the images with cloud errors (outliers) have been removed. As you can see, we see a large difference in our calculations once we remove the outliers.
 Great Lake Time Series
Overall, this process of calculating lake surface area from satellites allows us to create a holistic, long term, and dynamic picture of how lake surface area is changing and lend to our analysis of why some of those changes might be occurring. As this study continues, the lake stage measurements being taken by our citizen scientists will be combined with these lake surface area calculations to get a sense of overall lake volume change, better helping our understanding of how volume of water in lakes changes over time.
LOCSS News
We share stories about the lakes in our study, our partners and volunteer citizen scientists, as well as interesting results from our research.