Highs and Lows for Every Lake
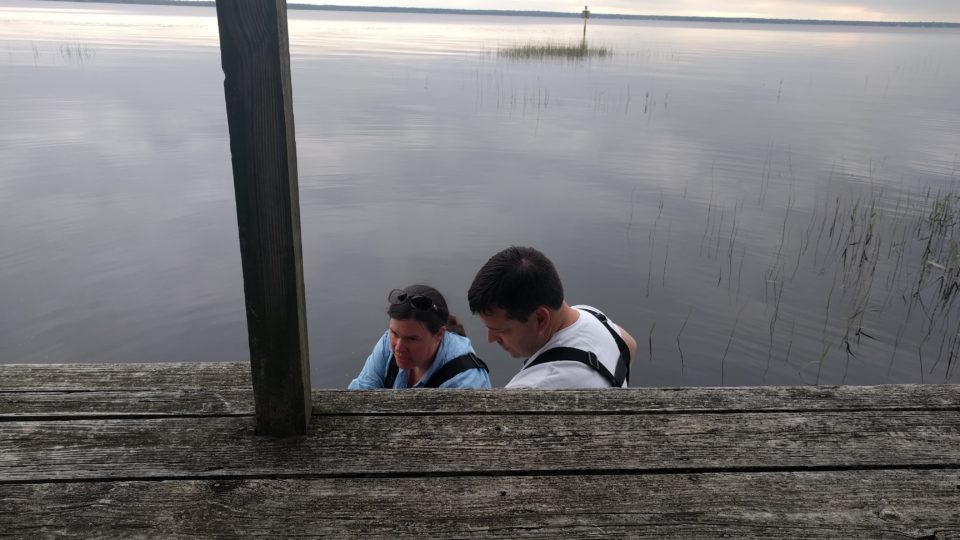
 GPS equipment measuring the elevation of East Loon Lake in Lake County Illinois
The LOCSS project had a banner year in 2019. During the year, we added 37 new lakes to the study, and expanded to two new states (Illinois and Massachusetts) and an additional country (France). We received a total of 2940 lake height measurements across our 62 study lakes in 2019. All of those measurements help us better understand these lakes, and when we looked a bit closer at the data, we found some very interesting things.
As mentioned in our 2019 Year in Review, the lake that showed the greatest change in lake height was Korchar Haor, in Bangladesh. The lowest measurement we received for this lake in 2019 was 0.61 meters on May 21. The lake reached a gauge height of 5.62 meters on July 13, an increase of 5.01 meters (nearly 16.5 feet) in just under two months. Lake levels in Harrier Lake in Illinois, on the other hand, showed very little change in 2019. We saw a difference of just 0.38 feet (about 4.5 inches) between its high and low levels for the year. Although we didn't begin studying Harrier Lake until late May, a change of just 4.5 inches over the last seven months of the year is quite stable.
We saw other interesting things happen to lakes in Illinois as well. East Loon Lake reached its lowest water level of the year (1.30 feet) on September 9. On September 13, it reached its highest level of the year at 2.82 feet, an increase of 1.52 feet in just 4 (very rainy) days. The annual high and low levels at McCullom Lake in McHenry County were separated by just 7 days. But in this case, the difference was less than 6 inches.
We saw lake height changes of at least 3 feet in 5 different study lakes. In addition to Korchar Haor, we observed a change of at least that much in our other 3 Bangladesh lakes as well. At Lake Wenatchee in Washington, we saw a difference of 4.64 feet between the highest reported water level and the lowest reported water level in 2019. In addition to these 5 lakes, we saw a total of 23 study lakes where water levels changed by at least 1.5 feet at some point in 2019.
The lake height data from 2019 can tell many interesting stories. Undoubtedly there are people who are interested in knowing about how the levels in their lake changed throughout the year. For that reason, we've compiled that information for each of our 62 study lakes, and we want to share that with you. Just click on the link below and find your lake!
LOCSS News
We share stories about the lakes in our study, our partners and volunteer citizen scientists, as well as interesting results from our research.