What Are We Actually Measuring?
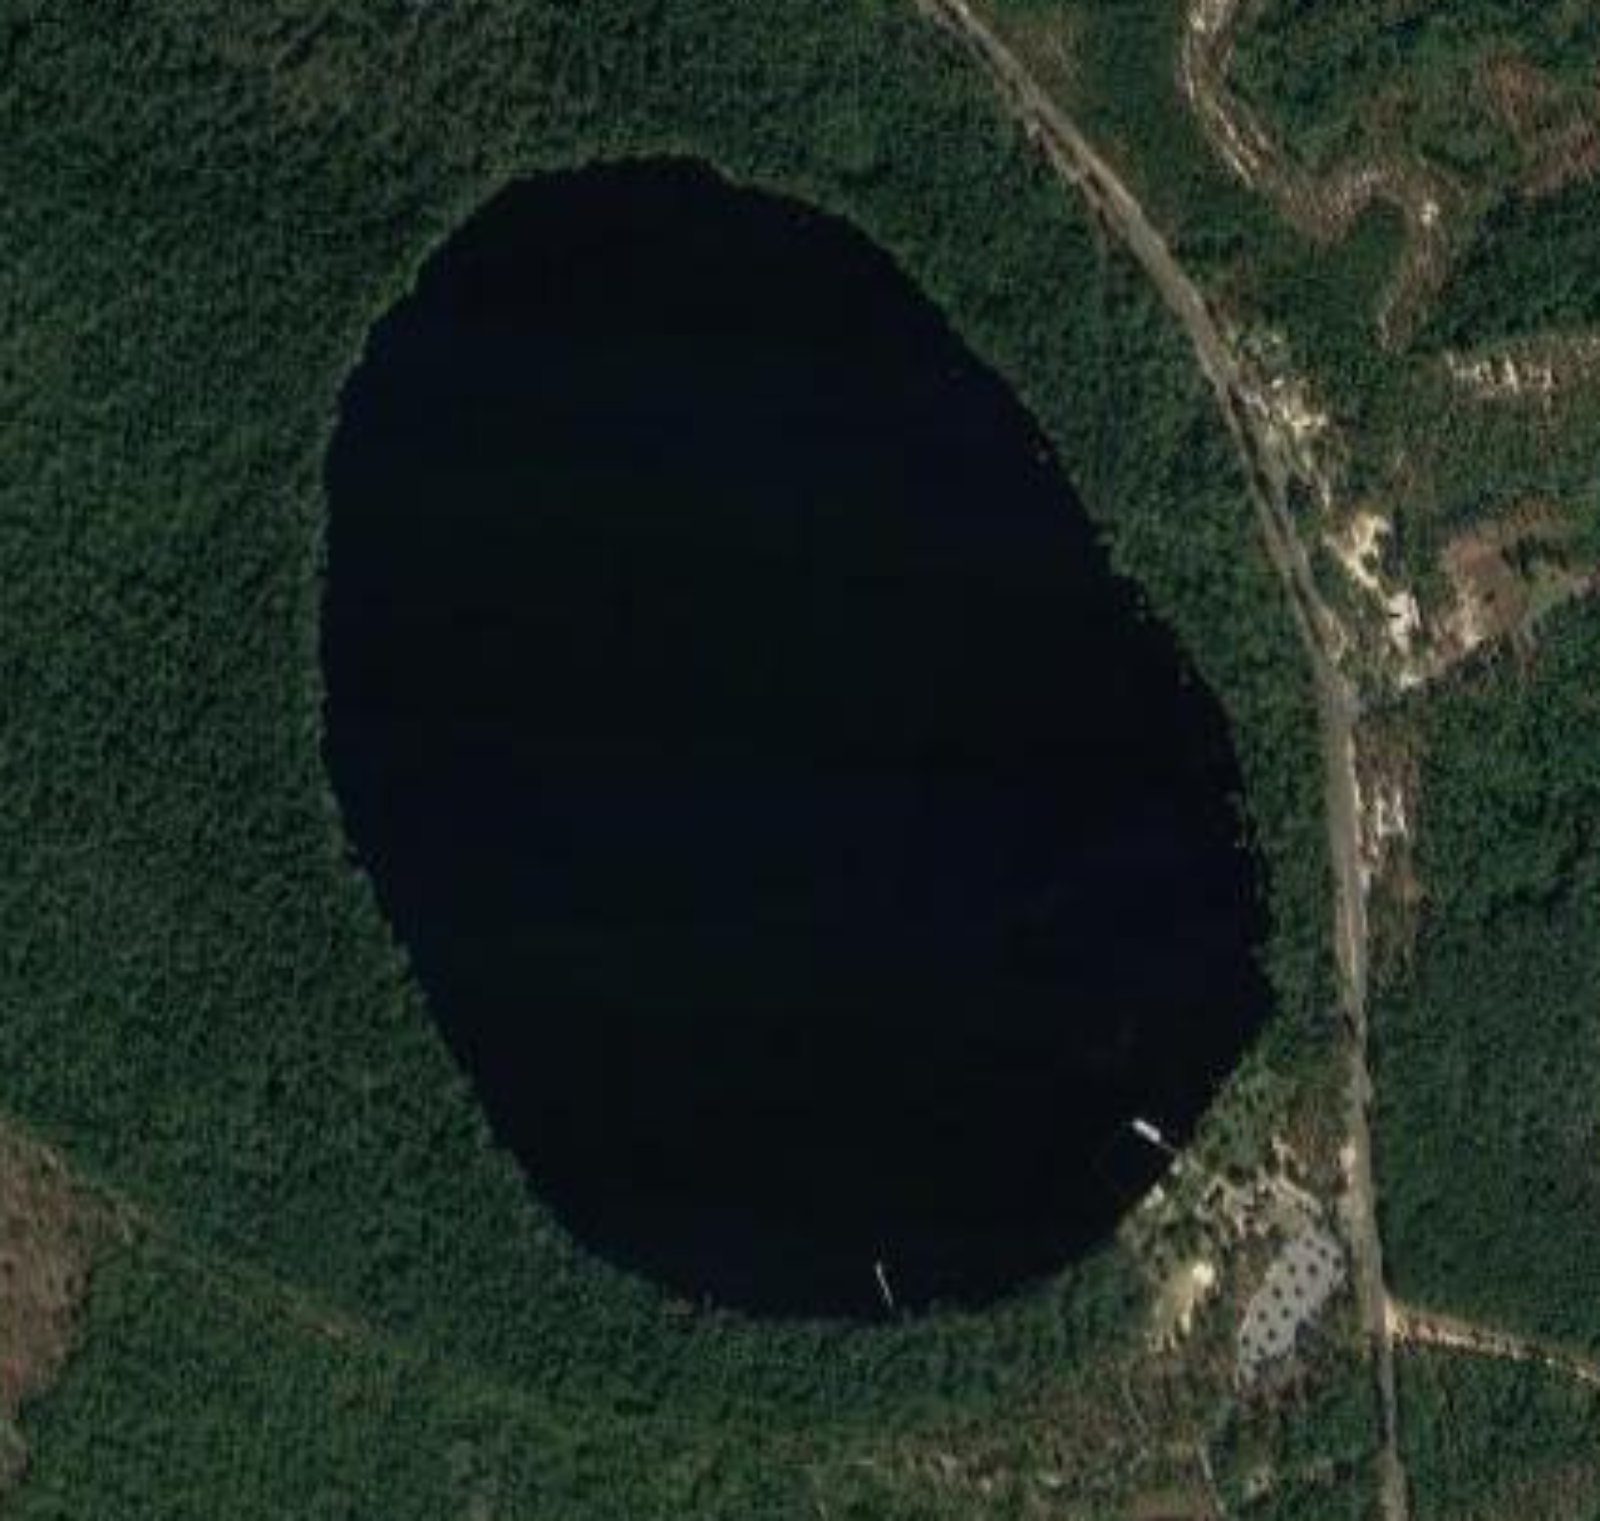 Satellite image of Jones Lake. - Image Courtesy of Google Maps
To do that, we are using data from both satellites and citizen scientists. So the question has come up, what are satellites and citizen scientists actually measuring?
We are using photographs taken by satellites to determine the area of the surface of the lake. Citizen scientists are also reporting the lake height. When we examine how those measurements change together, we can understand how the amount of water in the lake has changed.
Lake Area
Landsat 8 is a satellite that passes over our study lakes periodically, taking photographs as it travels. Provided the skies are clear, Landsat 8 photographs our lakes every 16 days. Our team uses those images to calculate the surface area of the lake. We could expect that in periods after heavy rains, the lake has a large surface area due to flooding, while in periods of extreme drought, the lake has a small surface area due to low amounts of water.
Lake Height
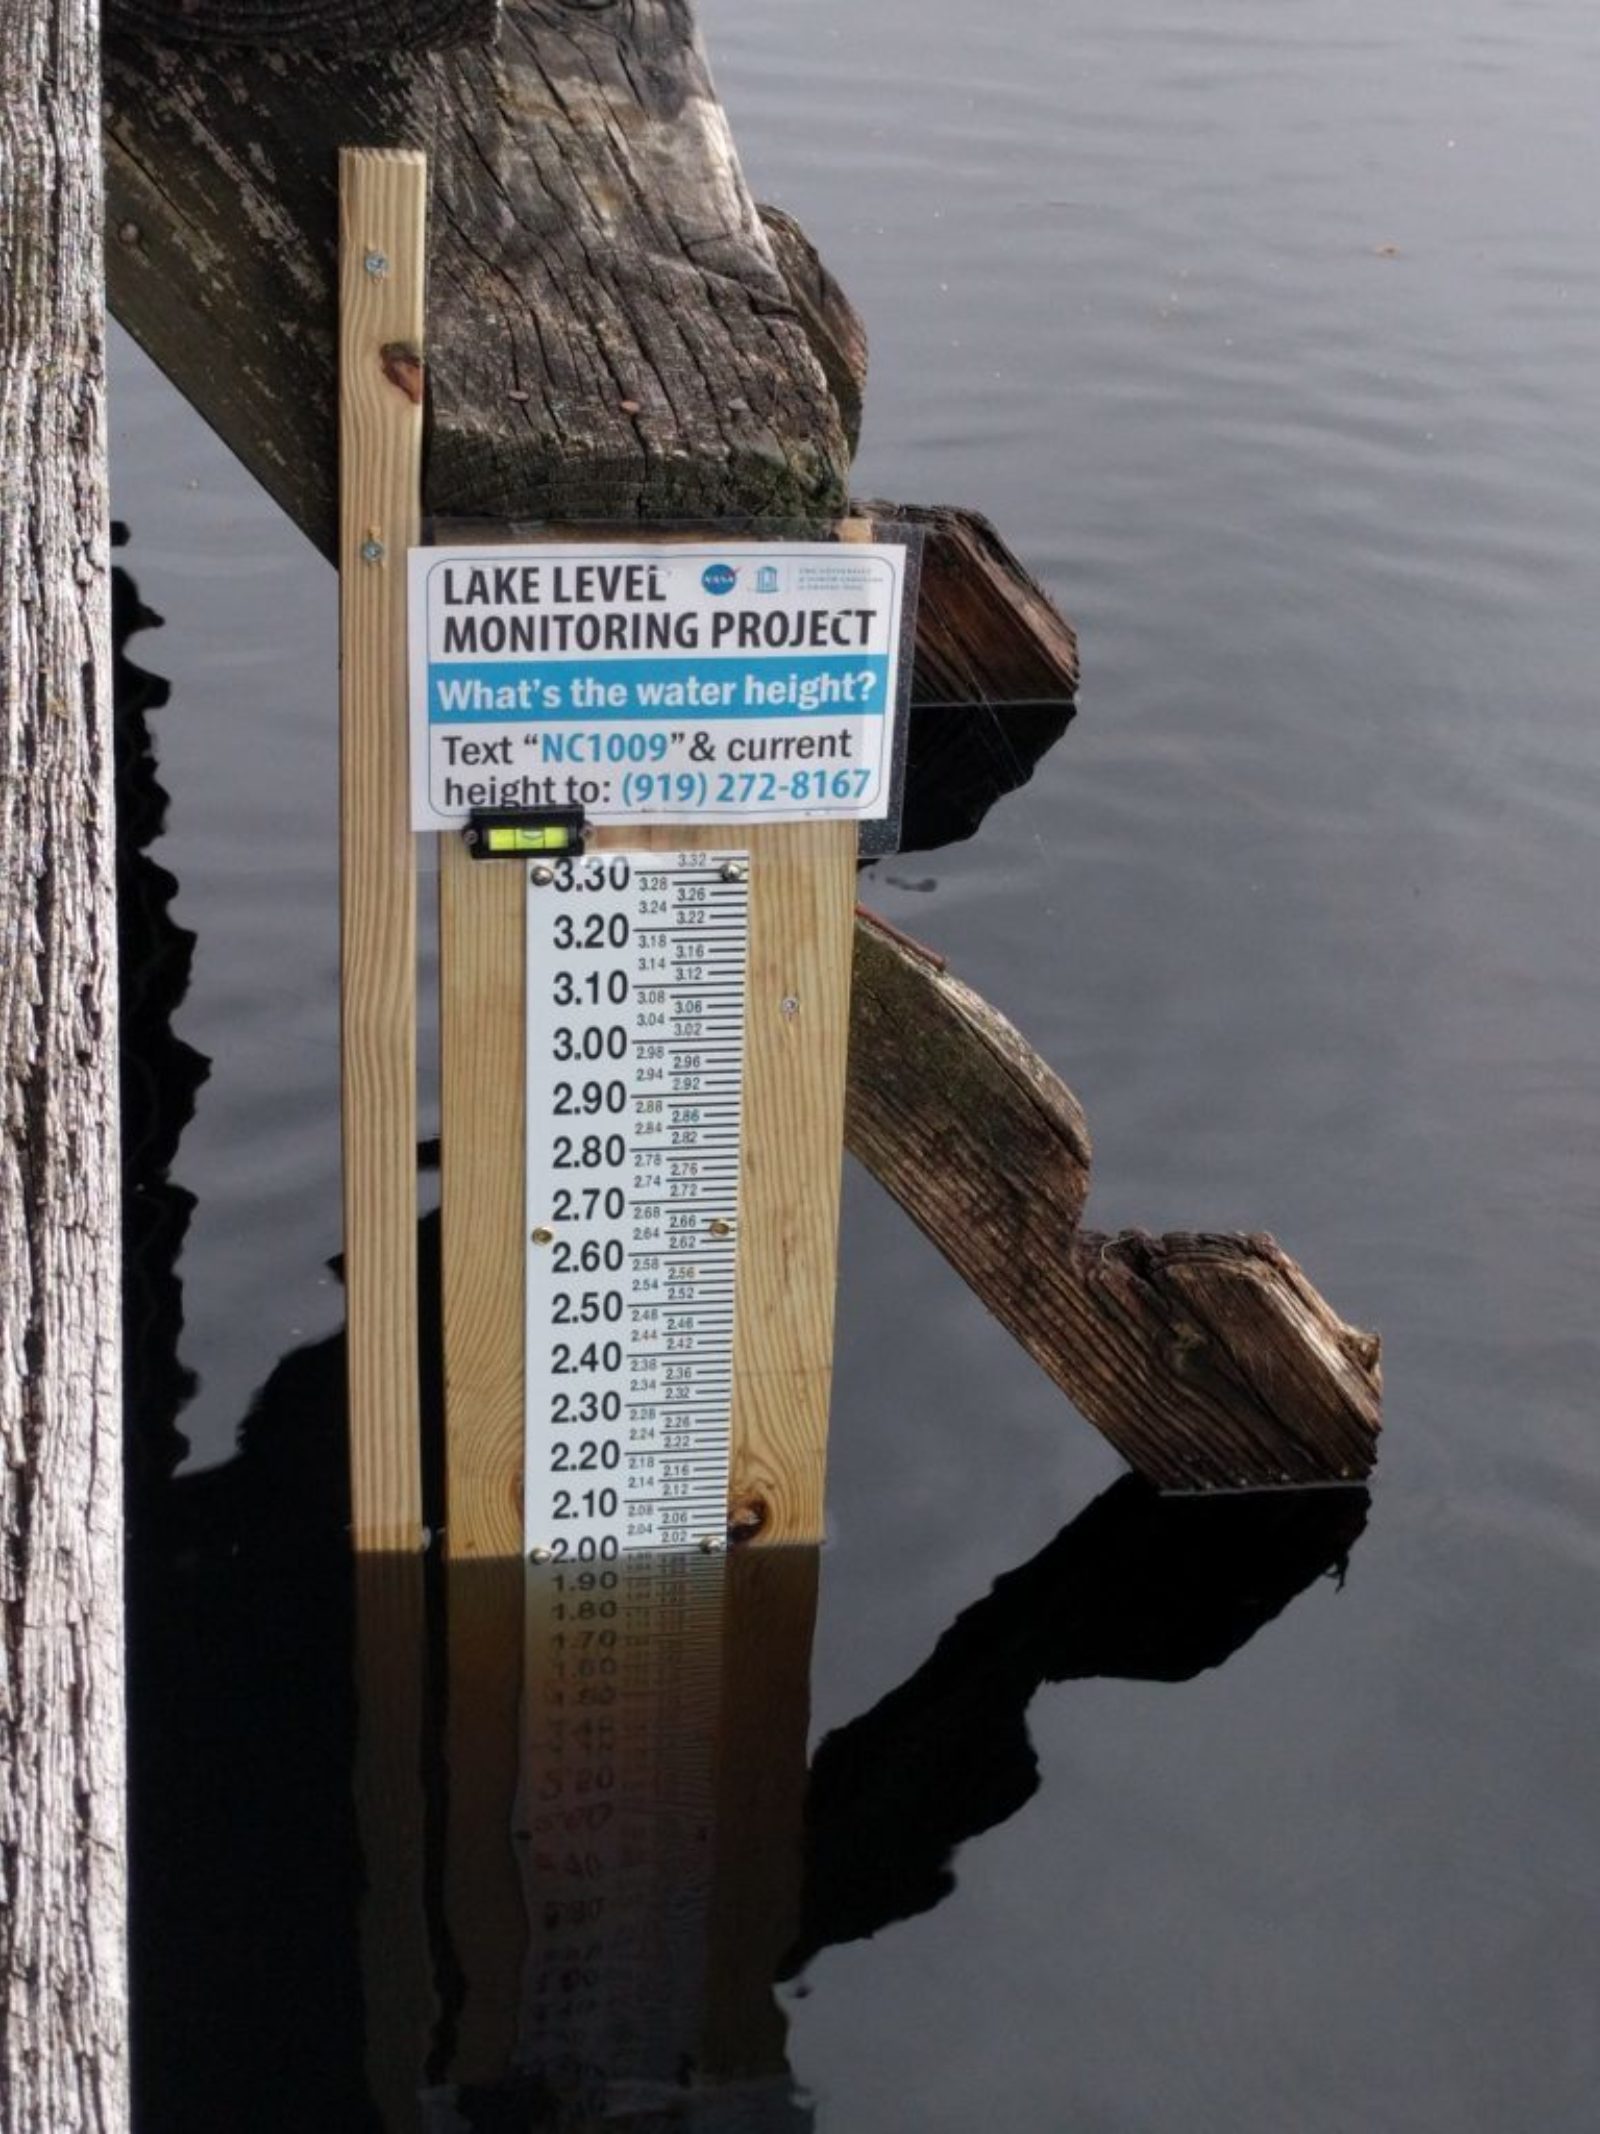 Lake Gauge showing a lake height of 2.48 feet. -Photo Taken by Harold Cain, Citizen Scientist
Our citizen scientists are helping measure lake height by reading the water level on a lake gauge that is installed in the lake (see photo). Is lake height the same as lake depth? No, lake height and depth are different. We know this because the 0.00 mark on the bottom of the gauge is not resting on the bottom of the lake, so our gauge is not useful in telling us the depth. However, by comparing lake height measurements that were taken on different days, we can see how the lake level may have risen or fallen.
What Does That Tell Us?
After we have the lake area and lake height measurements, then we can go to work to understand how the amount of water in the lake is changing. Let’s use Jones Lake, in Bladen County NC, as an example of how this was done.
The Landsat 8 satellite passed over Jones Lake, and was able to capture photographs on July 21 and August 22, 2017. Citizen scientists and park rangers at Jones Lake State Park were able to report lake heights on those days as well. The table below shows our surface area and lake height measurements on those days:
Jones Lake
| July 21, 2017 | August 22, 2017 | Change | |
|---|---|---|---|
| Lake Height | 1.18 Feet | 1.07 Feet | – 0.11 Feet |
| Surface Area | 209.6 Acres | 206.5 Acres | – 3.1 Acres |
You can see that, in those 32 days, the lake level fell 0.11 feet, or 1.32 inches. That doesn’t seem like a large drop. But we also see that the lake’s surface shrunk by 3.1 acres, which seems more significant.
If you know how the surface area of the lake changed, and you know how the lake height changed, then a bit of algebra can tell you how the volume of water changed. In this case, we found out that on August 22, Jones Lake had about 7.5 million gallons of water less than it had on July 21. To put it into perspective, that amount of water could fill more than 11 Olympic-sized swimming pools. So although a drop in lake height of just 1.32 inches may not seem like a lot, it actually represents an enormous amount of water lost from Jones Lake.
As Dr. Pavelsky notes in an earlier blog post, this water loss is probably to be expected due to increased heat and evaporation in the summer months. As we keep getting measurements through the fall and winter, it will be interesting to see if the lake height and surface area start to increase again. Stay tuned!
See all lake height measurements for Jones Lake here. View measurements for all lakes here.
LOCSS News
We share stories about the lakes in our study, our partners and volunteer citizen scientists, as well as interesting results from our research.