What Have We Learned About Lakes In North Carolina?
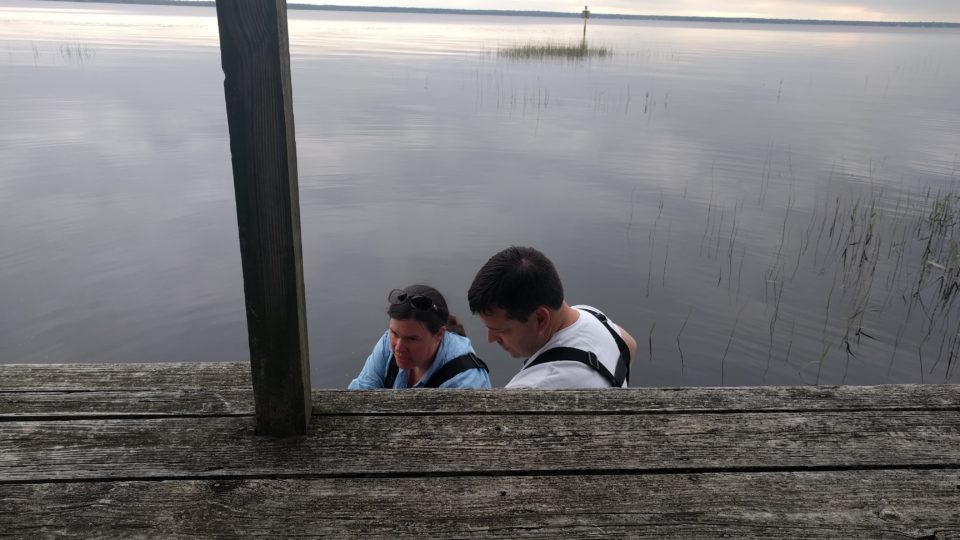
 Jones Lake in Bladen County, North Carolina.
The LOCSS project began in 2017, when we installed gauges in several lakes in Eastern North Carolina. We began by installing lake gauges and working with local partners and citizen scientists to measure changes in lake heights. We paired that information with measurements of lake surface area to see how the volume of water in those lakes is changing. From our North Carolina LOCSS lakes, we selected 12 North Carolina Lakes to better understand how lake volume is changing, and how those changes compare from lake to lake. On average, after running our analysis, water storage variations in pairs of lakes within the North Carolina study region are positively correlated, meaning that as one lake shows an increase or decrease in lake water volume, the other lake shows a similar increase or decrease. There is substantial variation in the degree of correlation, or how correlated these lakes are, however, with some pairs of lakes being highly correlated, showing similar changes, and others uncorrelated, showing no corresponding patterns of change or opposite patterns of change. For example, storage variations in Bay Tree Lake and Salters Lake are highly correlated, Bay Tree Lake and Lake Mattamuskeet East are moderately correlated, and Bay Tree Lake and Lake Waccamaw are only slightly correlated (Figure 1). All of this suggests that, at least in the places and over the time periods studied here, both regional factors, such as weather, and lake-specific factors, such as local drainage, matter a great deal in driving variations in lake water storage.
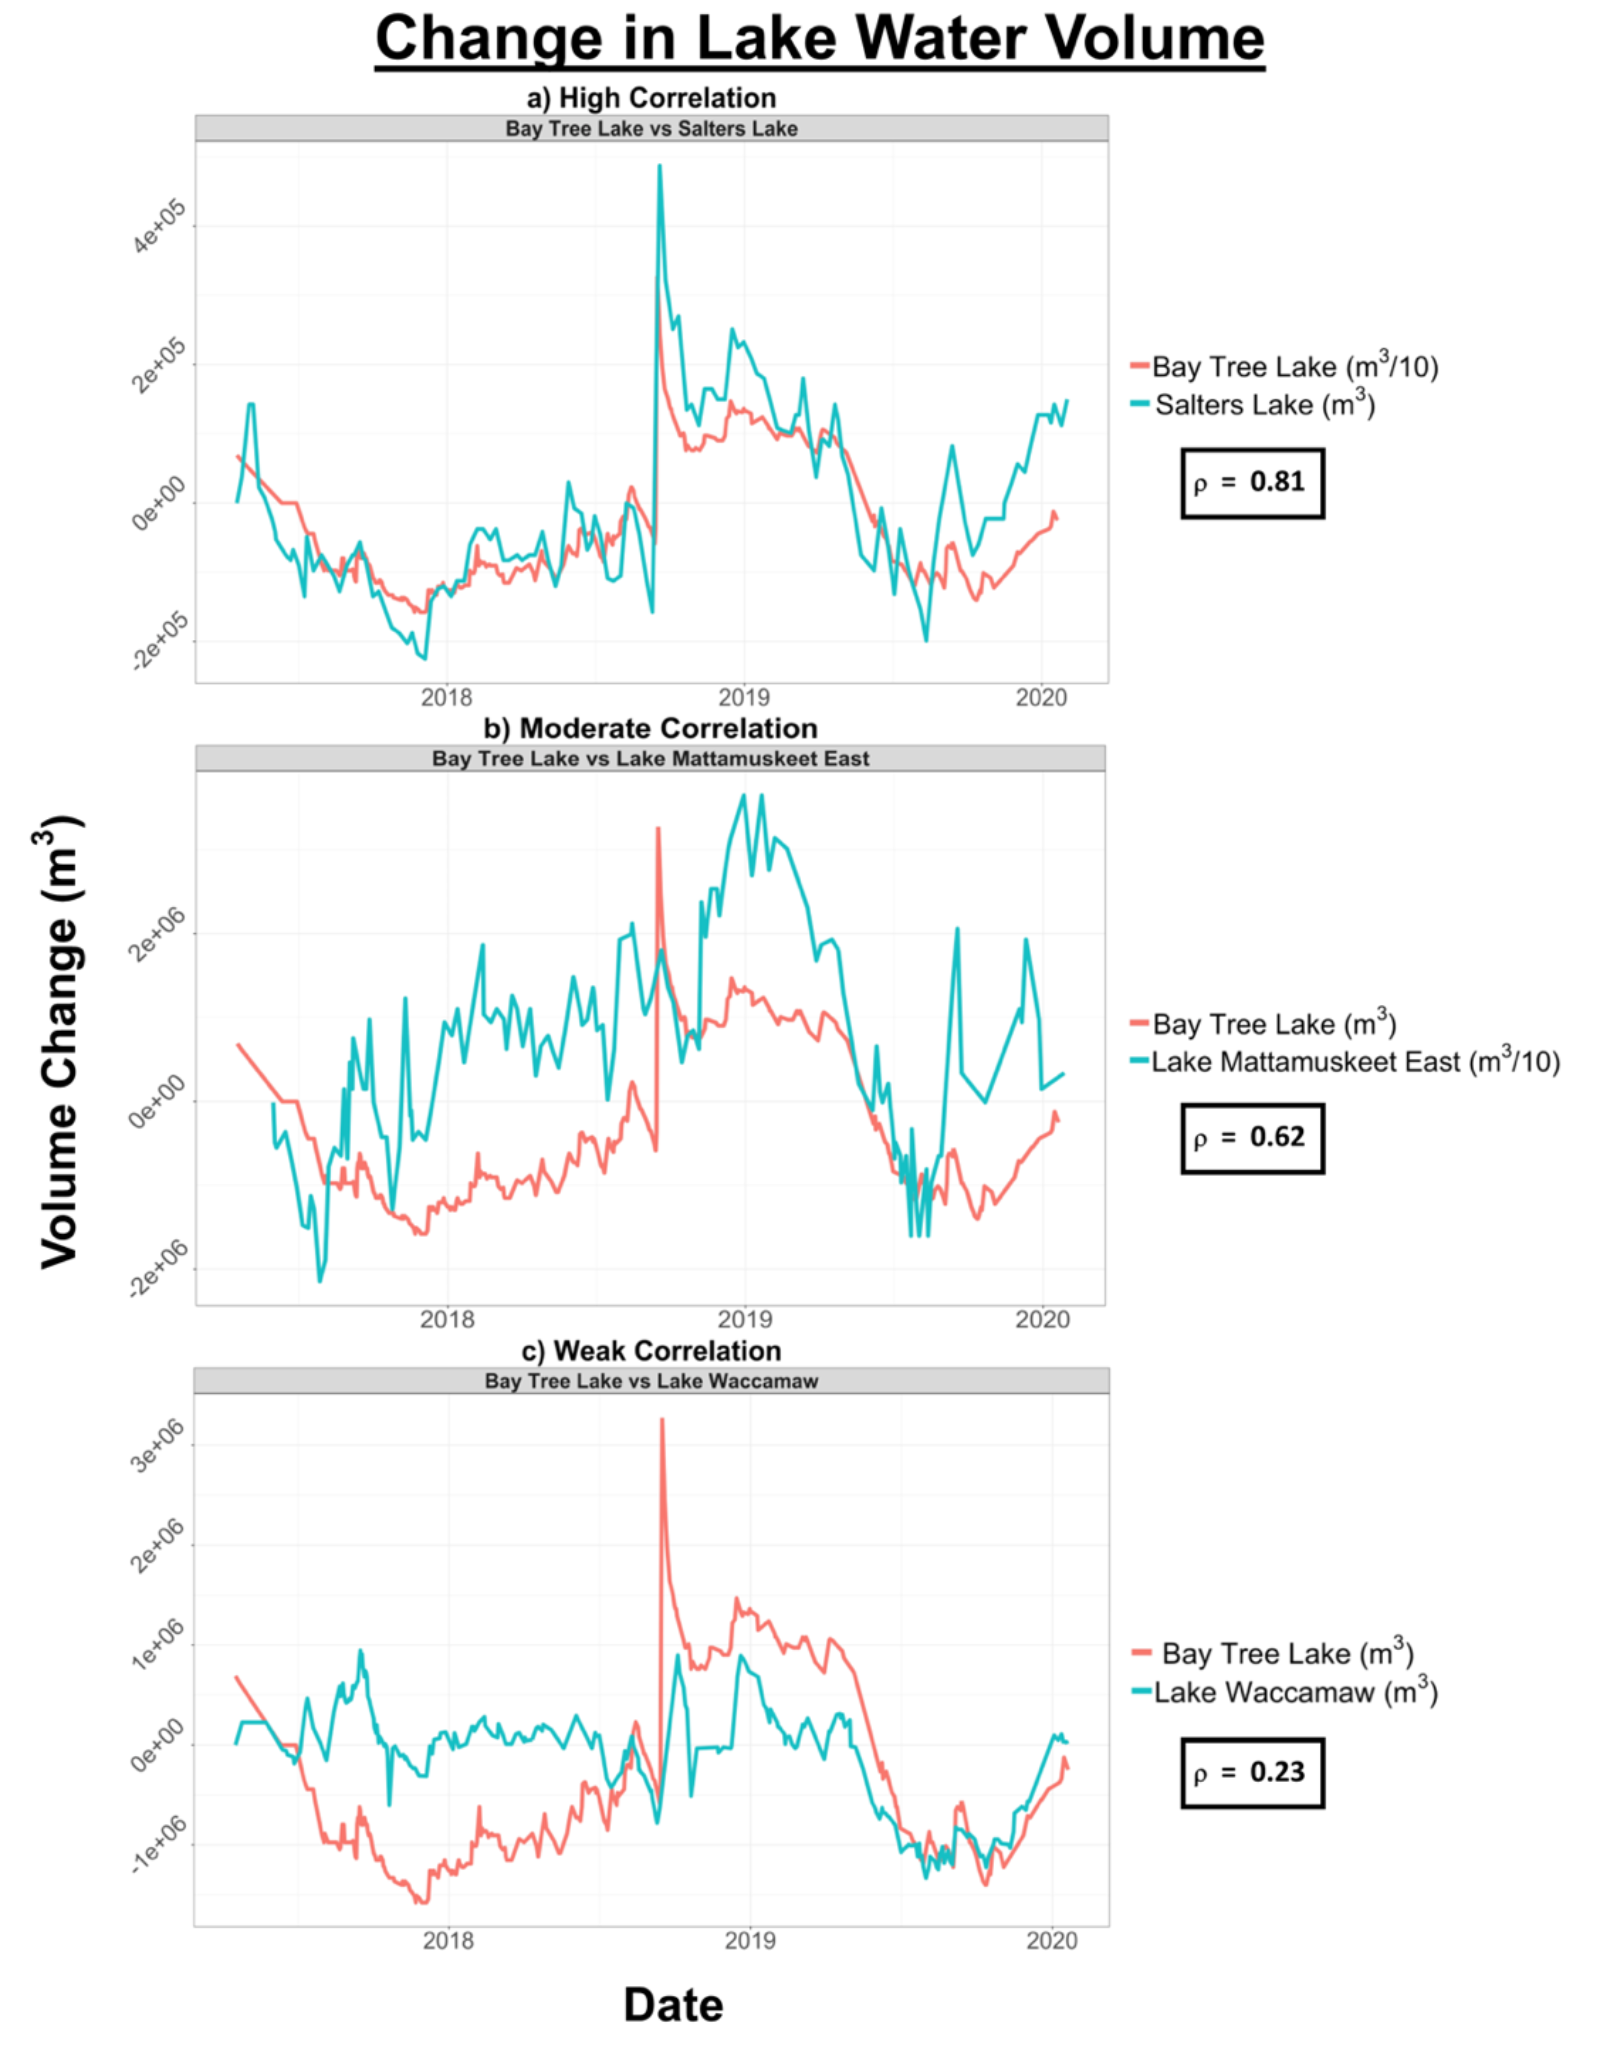 Figure 2. Lake water storage changes in Bay Tree Lake, NC compared to other NC lakes.
We then move to look at how distance between lake pairs and the strength of correlation relate to one another. To do this, we plotted the distance between lake pairs and the correlation of change in lake water storage of those lake pairs. We saw that there was no relationship in our North Carolina lakes (Figure 2). This means that lakes that are close together do not necessarily show more similarity in how their volumes change than lakes that are farther apart.
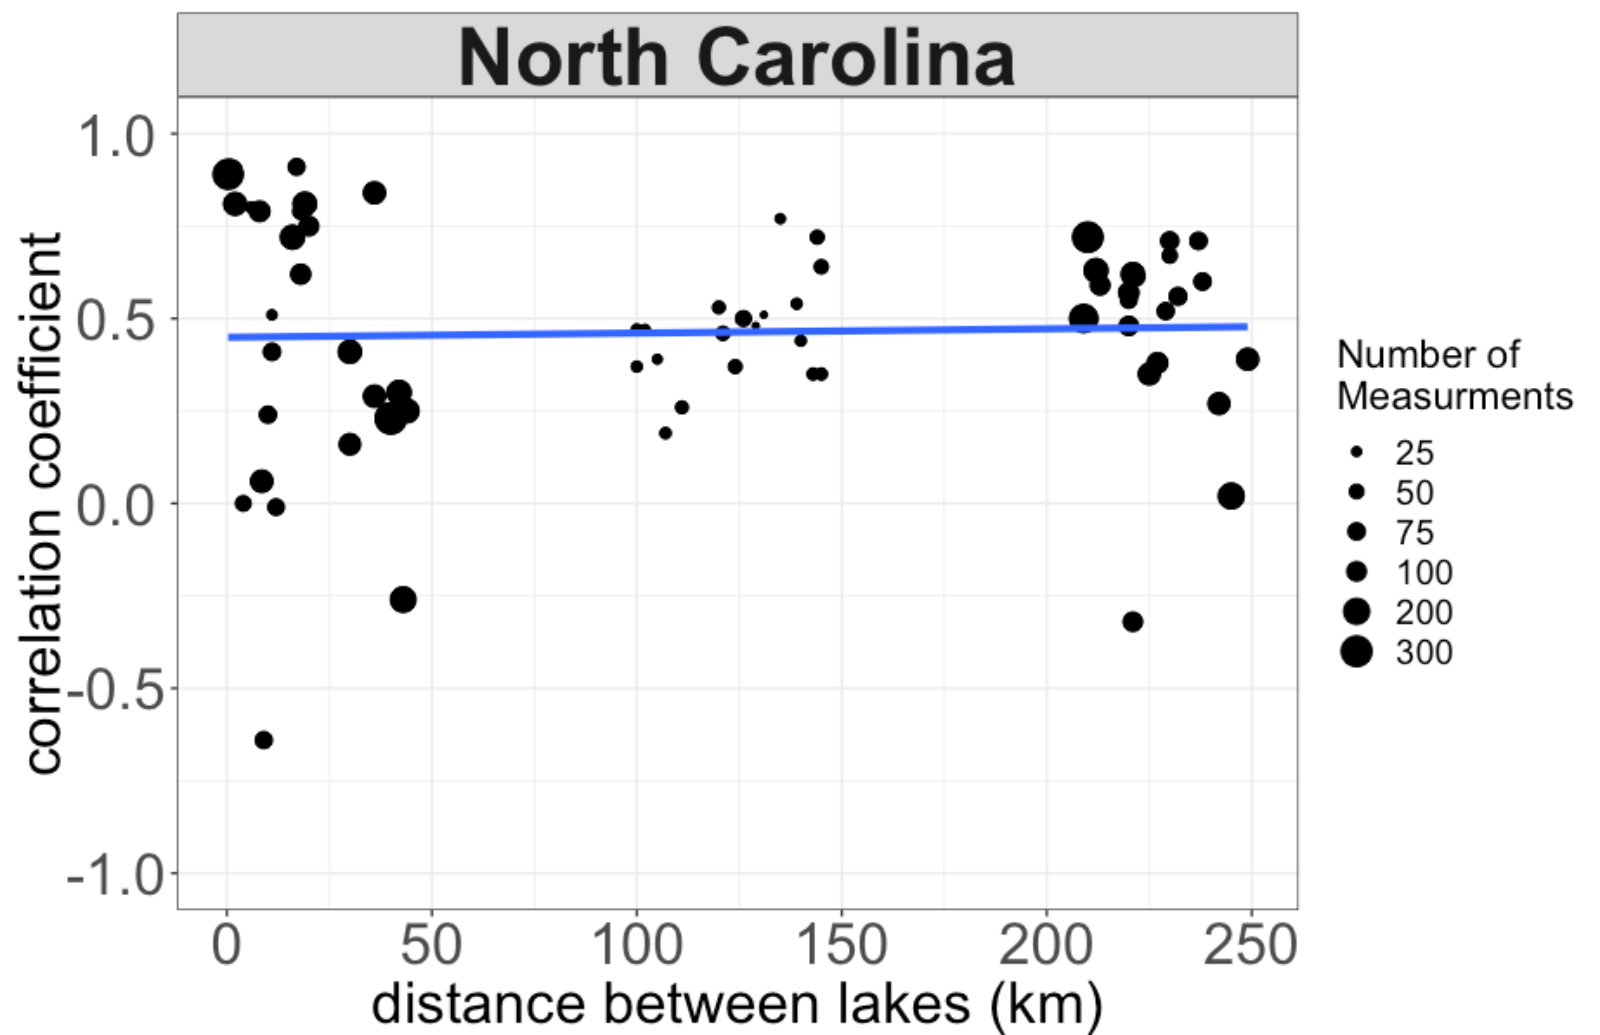 Figure 2 The correlation of volume changes among lake pairs in relation to the distance between lakes.
the figure above show how the correlation in lake volume changes between lake pairs relates to the distance between those lakes. On the y-axis (vertical) is correlation coefficient, which tells us how similar the changes in lake volume are between pairs of lakes in NC. If the correlation coefficient is near 1, there is a strong positive relationship, meaning the pattern of change is very similar. If the correlation coefficient is 0, there is no relationship. If the correlation coefficient is -1, there is a strong negative relationship, meaning that as the volume in one lake increases, the volume in the other decreases. On the x-axis (horizontal) is distance between lake pairs. There is no relationship seen in this plot between the distance of lake pairs and the correlations between their changes in storage. This means that lakes that are close together do not necessarily show more similarity in how their volumes change than lakes that are farther apart.
Further exploration is needed to determine what factors do control change in lake water storage in North Carolina between lakes. Extreme weather events could be one explanation. We can think back to Hurricane Florence, which occurred during the time of this study. Hurricane Florence impacted some North Carolina lakes much more than others. Another explanation could be soil type. While all of the lakes are in the sandy Coastal Plains region of the state, many have layers of dense organic materials on their lake beds. This serves as a kind of cap isolating the lake from ground water connectivity. The lack of this connectivity could represent the widespread and lack of overarching correlations we see.
This is the second in a series of posts that are meant to explain what we have learned about our lakes. The others include:
What Have We Learned About Our Study Lakes?
What Have We Learned About Lakes In Washington?
LOCSS News
We share stories about the lakes in our study, our partners and volunteer citizen scientists, as well as interesting results from our research.